From IDS to XDR: The Missing Link
Having a network IDS is great, but without a central brain to correlate alerts, you’re just collecting noise. That’s where Wazuh HA cluster deployment comes in. Wazuh gives us a full XDR platform: agents, a manager that analyzes data, an indexer for storage, and a dashboard for visualization. In a production environment, we can’t afford a single point of failure, so we’ll build a high‑availability cluster from the start—even if we start with single nodes, the architecture is ready to scale.
In this final article, we’ll deploy the Wazuh central components, secure them with certificates, integrate the Suricata sensor we built in Article 2, and create a SOC dashboard that turns raw logs into actionable intelligence.
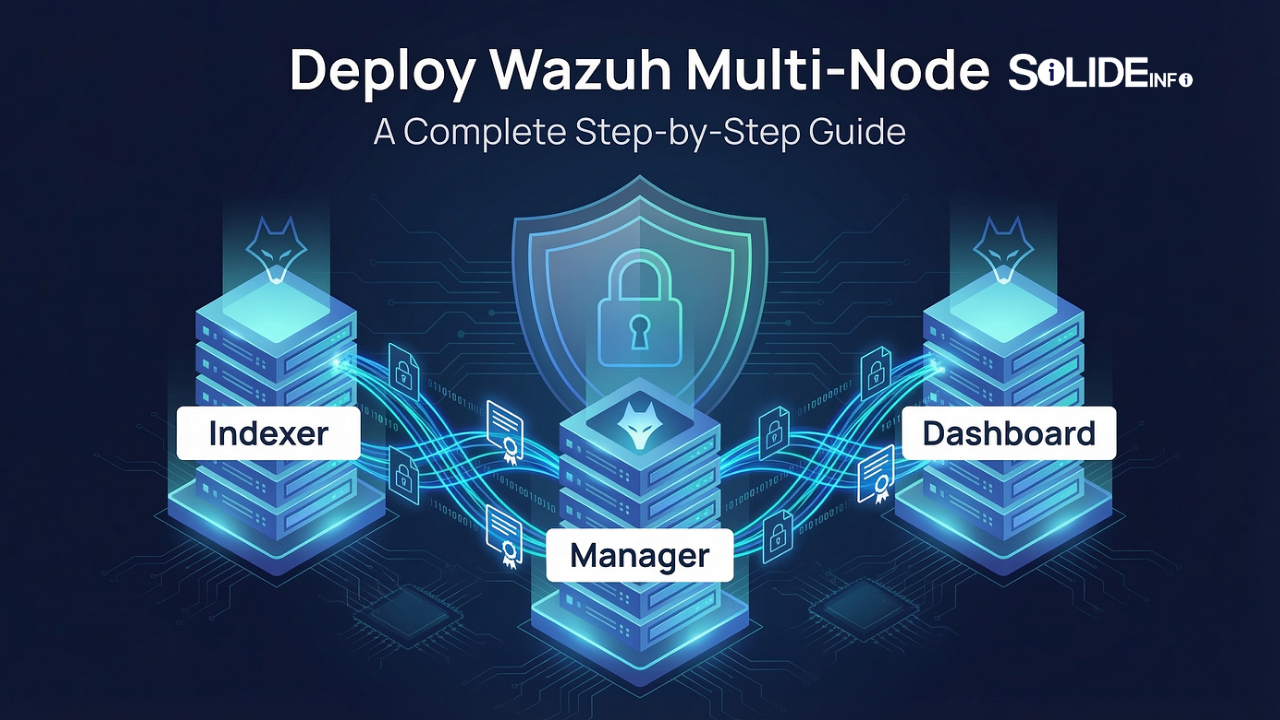
Distributed Components Overview
Our Wazuh stack consists of three types of nodes:
- Indexer (OpenSearch): Stores alerts and events. Can be clustered for redundancy.
- Manager: Receives and analyzes data from agents. Can run in a master‑worker cluster.
- Dashboard: Web interface. Stateless, can be load‑balanced.
For our initial deployment, we placed all three on separate VMs, each with the IPs listed earlier. The certificate generation tool expects a config.yml that lists all nodes. Here’s the relevant part:
yaml
nodes:
  indexer:
    - name: indexer-1
      ip: "10.0.68.2"
  server:
    - name: xdr-server-1
      ip: "10.0.155.183"
  dashboard:
    - name: dashboard
      ip: "10.0.254.239"
Generating Certificates (The Right Way)
Wazuh uses mutual TLS for all internal communications. We generated certificates using the official wazuh-certs-tool.sh. On the manager node:
bash
curl -sO https://packages.wazuh.com/4.14/wazuh-certs-tool.sh
curl -sO https://packages.wazuh.com/4.14/config.yml
# Edit config.yml to match your IPs
bash wazuh-certs-tool.sh -A
tar -cvf wazuh-certificates.tar -C ./wazuh-certificates/ .
Then we copied the archive to each node and extracted the appropriate files. For the indexer:
bash
mkdir /etc/wazuh-indexer/certs
tar -xf wazuh-certificates.tar -C /etc/wazuh-indexer/certs/ ./indexer-1.pem ./indexer-1-key.pem ./admin.pem ./admin-key.pem ./root-ca.pem
mv /etc/wazuh-indexer/certs/indexer-1.pem /etc/wazuh-indexer/certs/indexer.pem
# ... same for key
chmod 500 /etc/wazuh-indexer/certs
chmod 400 /etc/wazuh-indexer/certs/*
chown -R wazuh-indexer:wazuh-indexer /etc/wazuh-indexer/certs
The manager and dashboard got their own certificates similarly, using their node names as defined in config.yml.
Indexer Configuration and Cluster Initialization
The indexer’s configuration (/etc/wazuh-indexer/opensearch.yml) must include the node name, network host, and the distinguished names of all nodes that will talk to it (including the dashboard). Here’s the final, working configuration:
yaml
node.name: indexer-1
network.host: 10.0.68.2
cluster.initial_master_nodes: indexer-1
plugins.security.nodes_dn:
  - "CN=indexer-1,OU=Wazuh,O=Wazuh,L=California,C=US"
  - "CN=dashboard,OU=Wazuh,O=Wazuh,L=California,C=US"
We restarted the indexer and waited for it to come up:
bash
systemctl restart wazuh-indexer
systemctl status wazuh-indexer
Manager and Filebeat: The Data Pipeline
The manager needs Filebeat to forward alerts to the indexer. After installing wazuh-manager and filebeat, we configured Filebeat to point to our indexer and use the appropriate certificates:
yaml
output.elasticsearch:
  hosts: ["10.0.68.2:9200"]
  protocol: https
  username: ${username}
  password: ${password}
We stored the credentials (the logstash user and its password from the certificate generation) in a keystore:
bash
filebeat keystore create
echo "logstash" | filebeat keystore add username --stdin --force
echo "2QscQpyZf6QmM5sVF?S4mOT96Ch.VKVH" | filebeat keystore add password --stdin --force
We also configured the manager itself to talk to the indexer for vulnerability detection (optional). That’s done via a keystore for the manager and a section in ossec.conf:
xml
<indexer>
  <enabled>yes</enabled>
  <hosts>
    <host>https://10.0.68.2:9200</host>
  </hosts>
  <ssl>
    <certificate_authorities>
      <ca>/etc/filebeat/certs/root-ca.pem</ca>
    </certificate_authorities>
    <certificate>/etc/filebeat/certs/filebeat.pem</certificate>
    <key>/etc/filebeat/certs/filebeat-key.pem</key>
  </ssl>
</indexer>
The credentials were added with:
bash
echo "admin" | /var/ossec/bin/wazuh-keystore -f indexer -k username
echo "GENEREATE_RANDOM_PASS" | /var/ossec/bin/wazuh-keystore -f indexer -k password
Dashboard: The Final Piece
The dashboard connects to the indexer using the kibanaserver account and to the manager’s API using the wazuh-wui account. The configuration (/etc/wazuh-dashboard/opensearch_dashboards.yml) looked like this after securing:
yaml
server.host: 0.0.0.0
server.port: 443
opensearch.hosts: ["https://10.0.68.2:9200"]
opensearch.ssl.verificationMode: certificate
opensearch.username: kibanaserver
opensearch.password: "HJWnGGQXcvNoXx2ZKyOvqxDjWEJ*boz+"
server.ssl.enabled: true
server.ssl.key: "/etc/wazuh-dashboard/certs/dashboard-key.pem"
server.ssl.certificate: "/etc/wazuh-dashboard/certs/dashboard.pem"
opensearch.ssl.certificateAuthorities: ["/etc/wazuh-dashboard/certs/root-ca.pem"]
We also had to give the Node.js binary the ability to bind to privileged ports (443):
bash
setcap 'cap_net_bind_service=+ep' /usr/share/wazuh-dashboard/node/bin/node
After a few restarts, the dashboard came up and we could log in.
Integrating Suricata Alerts via Wazuh Agent
The Suricata VM already had the Wazuh agent installed (as shown in Article 2). The agent’s configuration included a localfile to read eve.json. That was enough—the agent automatically forwards the JSON logs to the manager, which decodes them and creates alerts. We verified this by searching the index for events with rule.groups: suricata.
bash
root@xdr-manager-01:~# grep "suricata" /var/ossec/logs/alerts/alerts.json | head -1
{"timestamp":"2026-03-18T16:03:12.266+0000","rule":{"level":3,"description":"Suricata: Alert - SURICATA ICMPv6 invalid checksum", ...}
Visualizing Data: Dashboard Creation


With events flowing in, we built a custom dashboard to monitor IDS activity. Using the Discover tab, we filtered on rule.groups: suricata and selected the following fields:
data.alert.signaturedata.src_ipdata.dest_ipdata.alert.severity
We then created visualizations:
- Pie chart of top signatures.
- Bar chart of severity distribution.
- Data table of source IPs.
- Line chart of alert volume over time.
Each visualization was saved and added to a dashboard named “Suricata Alerts”.
The Full XDR Data Flow

Securing the Installation: Changing Default Passwords
The final step was to rotate all default passwords. The indexer came with a default admin password; we used the built‑in tool to generate new ones:
bash
/usr/share/wazuh-indexer/plugins/opensearch-security/tools/wazuh-passwords-tool.sh --change-all
On the manager, we ran the API password tool:
bash
bash wazuh-passwords-tool.sh --api --change-all --admin-user wazuh --admin-password wazuh
We then updated the dashboard’s wazuh.yml with the new wazuh-wui password and restarted the dashboard.
All credentials were stored in a secure vault, never committed to version control.
A Production‑Ready XDR Cluster
With these three articles, we’ve built a complete SOC platform: hardened infrastructure, network visibility with Suricata, and a distributed Wazuh XDR cluster. The Wazuh HA cluster deployment we’ve architected can scale to multiple nodes, ingest logs from hundreds of agents, and present a unified view of security events.
Whether you’re running a small lab or a large enterprise, this blueprint gives you a solid foundation. The next step is to add more agents, create custom rules, and integrate threat intelligence feeds. But for now, your XDR engine is live.
Discover more from Solide Info | The Engineer’s Authority on Cyber Defense
Subscribe to get the latest posts sent to your email.