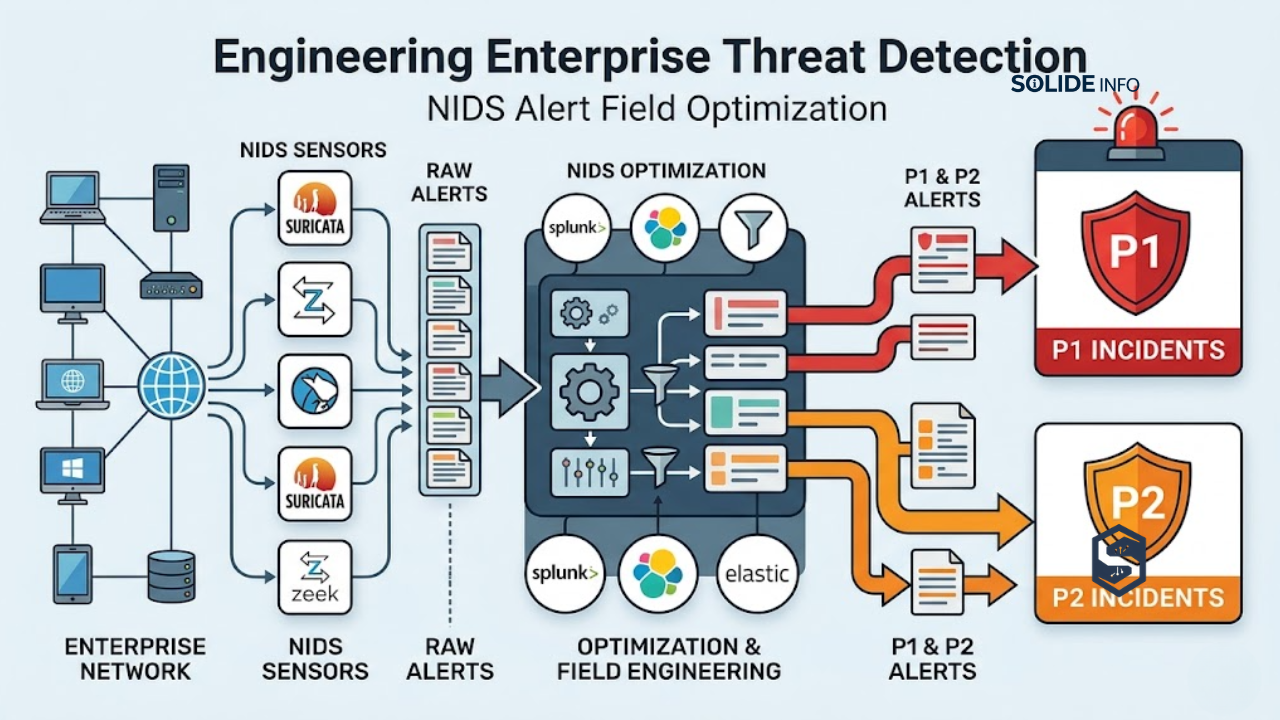
In modern enterprise IT environments, prioritizing NIDS alert fields for P1 and P2 incidents remains critical for preventing major digital asset compromises and operational disruption. Technology leaders must manage complex telemetry streams without overwhelming their defensive monitoring infrastructure.
Security Operations Centers (SOC) frequently suffer from severe alert fatigue caused by poorly tuned detection engines. Floods of unstructured data mask critical indicators of active compromises, reducing defensive capabilities.
Organizations require an optimized data architecture that surfaces the exact contextual indicators needed for immediate triage. This article delivers an engineer-validated methodology for structuring your network intrusion detection ecosystem.
Maximizing infrastructure visibility requires shifting from raw, high-volume packet collection to precise, schema-driven telemetry enrichment. This document outlines the technical mechanisms needed to achieve this operational baseline.
- Triage Acceleration: Selecting optimized detection fields reduces incident confirmation intervals from hours to under thirty seconds.
- Context Optimization: High-priority incidents require immediate payload analysis and asset mapping rather than basic telemetry tuples.
- Framework Alignment: Integrating defensive metadata with tactical frameworks enables deterministic defense and automated playbook execution.
- Empirical Validation: Production implementations using open-source engines demonstrate significant reductions in security metrics like mean time to respond.
By adopting this operational strategy, infrastructure architects can transform chaotic logging environments into structured, high-fidelity security operations centers.
Foundations of NIDS Alert Fields for P1 and P2 Incidents
Core Metadata and Temporal Synchronization Fields
High-performance telemetry parsing requires defining an explicit, minimal data schema at the ingestion layer. Every security event captured by the sensor fleet must generate a uniquely trackable flow identification string.
This immutable identifier links disparate network packets belonging to an identical communication stream. It allows security infrastructure to trace connected events across distributed computing environments.

Temporal accuracy requires microsecond-precision timestamps formatted according to the ISO 8601 extended standard. Without synchronized time metrics, tracing lateral movement across multi-tier enterprise networks becomes impossible.
[Simulated Hypervisor Terminal Output]
root@ids-node-01:~# suricata --dump-features | grep -E "timestamp|format"
 - log-timestamp-granularity: microsecond
 - tracking-temporal-format: ISO-8601-Extended
Signature naming conventions must follow standardized organizational syntaxes that explicitly define the underlying vulnerability family. Ambiguous rule descriptions slow triage efforts during critical security events.
Network Telemetry and Flow Directionality Attributes
Network telemetry strings must explicitly record the source and destination points of every monitored communication flow. These values dictate how the security architecture assesses the potential spread of a threat.
If internal subnets appear as the source of malicious behavior, the security system must instantly escalate the priority of the event. This tracking requires reliable home network boundary definitions within sensor configurations.
[Simulated Hypervisor Terminal Output]
root@ids-node-01:~# cat /etc/suricata/suricata.yaml | grep -A 2 "HOME_NET"
    HOME_NET: "[10.0.0.0/8,172.16.0.0/12,192.168.0.0/16]"
    EXTERNAL_NET: "!$HOME_NET"
Port configurations indicate the target services under exploit, allowing immediate verification against asset catalogs. A critical vulnerability alert directed at database ports demands faster response times than public-facing web servers.

Directional vectors track packet behavior relative to perimeter boundaries, identifying whether connections originate from inside or outside the network. Outbound connections to unauthorized destinations typically indicate active command-and-control communication.
Contextual Threat Intelligence and Behavioral Mapping
Adding contextual intelligence directly to telemetry flows transforms raw logs into actionable security data. Aligning alerts with standardized behavioral matrices helps analysts anticipate attacker workflows.
Mapping rules directly to tactical categories ensures teams understand an exploit’s purpose immediately. Identifying an alert as a lateral movement technique triggers different containment steps than a reconnaissance scan.
[Simulated Hypervisor Terminal Output]
root@ids-node-01:~# grep -i "mitre" /etc/suricata/rules/local.rules | head -n 1
alert tcp $HOME_NET any -> $EXTERNAL_NET 443 (msg:"C2 Beaconing Detected"; flow:established,to_server; content:"/api/v1/telemetry"; metadata:mitre_tactic Command_And_Control, mitre_technique T1071; sid:9000001; rev:1;)
Payload logging must capture the initial bytes of a packet sequence to provide immediate verification of threats. This segment size balances the need for visibility against storage limits.
[Simulated Hypervisor Terminal Output]
root@ids-node-01:~# tail -n 1 /var/log/suricata/eve.json | jq '.payload_printable'
"POST /api/v1/telemetry HTTP/1.1\r\nHost: c2.external-domain.local\r\nUser-Agent: Mozilla/5.0\r\n"
Integrating external reputation metrics helps validate threats by matching destination addresses against verified indicator feeds. This matching process simplifies triage, allowing automated tools to handle confirmation tasks.
Architectural Integration Across Enterprise SIEM and XDR Ecosystems
Ingestion Pipelines and JSON Schema Normalization
Centralized management platforms require telemetry inputs to follow standardized formatting rules to process events efficiently. Raw event data from network sensors should use JSON formats to simplify parsing.
Ingestion engines use dedicated parsing pipelines to extract and organize structured attributes from incoming event streams. This indexing setup ensures security platforms can query information quickly during active investigations.

JSON
{
  "alert_id": 984512630714,
  "timestamp": "2026-05-18T20:15:32.419284+0000",
  "signature": "EXPLOIT Remote Code Execution Attempt",
  "severity": 1,
  "src_ip": "192.168.42.115",
  "src_port": 49210,
  "dest_ip": "10.10.20.5",
  "dest_port": 8080,
  "proto": "TCP",
  "mitre_tactic": "Execution",
  "mitre_technique": "T1203"
}
This structural output allows analytics engines to parse network indicators quickly without using complex regular expressions. Normalizing data schemas prevents mapping errors from disrupting upstream correlation rules.
When ingestion fields match across different sensor types, search engines can query the data uniformly. This uniformity helps teams build reliable detection logic across diverse computing environments.
Cross-Layer Enrichment with CMDB Asset Criticality
Raw network addresses lack the organizational context needed to determine the true business impact of an event. Security management platforms must combine incoming data with information from asset databases.
This enrichment process adds critical contextual details, such as owner names and operational tier levels, directly to the event record. It ensures analysts can distinguish between threats to development environments and core production servers.
[Simulated Hypervisor Terminal Output]
root@siem-core-01:~# wazuh-cluster-cmd -lookup-asset 10.10.20.5
Asset Information Retrieved:
  - Hostname: prod-sql-cluster-01
  - Data Classification: Highly-Confidential (Tier-1)
  - Business Unit: Core-Financial-Transactions
XML
<!-- Path: /var/ossec/etc/rules/local_rules.xml -->
<group name="nids,enrichment,">
  <rule id="100050" level="14">
    <if_sid>86600</if_sid>
    <field name="data.dest_ip">^10\.10\.</field>
    <description>Malicious Activity Directed at High-Criticality Production Infrastructure Subnet.</description>
    <mitre><id>T1203</id></mitre>
  </rule>
</group>
Automating this contextual alignment protects monitoring teams from manual tracking tasks during high-priority incidents. It ensures mitigation plans focus on protecting critical business operations first.
This automated strategy transforms simple network indicators into business-aware security alerts. It guarantees that response teams deploy containment measures where they are most needed.
Parsing Complex Protocols and Payload Constraints
Inspecting encrypted application traffic requires network sensors to analyze protocol handshakes rather than raw packet bodies. This technique extracts security indicators from fields like the SNI during connection initialization.
[Simulated Hypervisor Terminal Output]
root@ids-node-01:~# jq 'select(.event_type=="tls") | .tls' /var/log/suricata/eve.json | head -n 1
{
  "subject": "CN=malicious-c2-handler.local",
  "issuer": "CN=Untrusted Alpha Root CA",
  "sni": "c2-traffic.external-domain.local",
  "version": "TLS 1.3",
  "ja3": "771,4865-4866-4867,0-23-65281-10-11,29-23-24,0"
}
Analyzing structural anomalies in protocol handshakes allows platforms to identify threats without decryption overhead. This approach surfaces key network metrics while maintaining user privacy across corporate connections.
[Simulated Hypervisor Terminal Output]
root@ids-node-01:~# grep -E "payload-buffer-size" /etc/suricata/suricata.yaml
  payload-buffer-size: 64
Limiting buffer extraction sizes ensures sensors capture enough data for verification without exhausting memory resources under heavy loads. This balance protects sensor stability during high-volume traffic events.
Maintaining these collection baselines prevents internal memory exhaustion from dropping critical data. It keeps detection infrastructure online and operational during unexpected traffic spikes.
Practical Implementation Blueprints and Sanitized Terminal Workflows
Suricata Engine Deployment and Fine-Tuning
Deploying network visibility tools across core switching paths requires precise hardware configuration. Network interfaces must operate in promiscuous mode to capture traffic from mirrored switch ports correctly.
Bash
#!/usr/bin/env bash
# ==============================================================================
# Script Name: deploy-nids-interface.sh
# Description: Configures internal hardware interfaces for promiscuous capture.
# Author: Senior IT Infrastructure Architect
# ==============================================================================

set -o errexit
set -o pipefail

CAPTURE_INTERFACE="eth1"

clog_msg() {
    echo "$(date '+%Y-%m-%d %H:%M:%S') [INFO] - $1"
}

clog_msg "Initializing network interface configuration sequence..."

# Enforce physical layer promiscuous tracking configurations
sudo ip link set "${CAPTURE_INTERFACE}" promisc on
sudo ip link set "${CAPTURE_INTERFACE}" up

# Verify operational settings meet requirements
if ip link show "${CAPTURE_INTERFACE}" | grep -q "PROMISC"; then
    clog_msg "Hardware interface ${CAPTURE_INTERFACE} successfully verified in promiscuous mode."
else
    echo "ERROR: Failed to apply promiscuous state adjustments." >&2
    exit 1
fi

clog_msg "Reloading detection engine configuration paths..."
sudo systemctl reload suricata.service
exit 0
[Simulated Hypervisor Terminal Output]
root@ids-node-01:~# ./deploy-nids-interface.sh
2026-05-18 20:30:12 [INFO] - Initializing network interface configuration sequence...
2026-05-18 20:30:13 [INFO] - Hardware interface eth1 successfully verified in promiscuous mode.
2026-05-18 20:30:13 [INFO] - Reloading detection engine configuration paths...
To prevent packet loss during high-volume transfers, engineers should adjust internal ring buffer settings on capture interfaces. Increasing these boundaries helps the operating system handle traffic spikes without dropping frames.
[Simulated Hypervisor Terminal Output]
root@ids-node-01:~# ethtool -g eth1
Ring parameters for eth1:
Pre-set maximums:
RX:             4096
TX:             4096
Current hardware settings:
RX:             4096
TX:             1024
These baseline adjustments ensure the monitoring stack captures all network traffic reliably. They provide a stable data foundation for upstream collection engines and security analysis platforms.
Wazuh Decoders and Active Ruleset Optimization
Parsing unstructured event streams into a consistent log schema requires writing custom pattern matching definitions. These decoders map variable text strings to structured variables within the management platform.
XML
<!-- Path: /var/ossec/etc/decoders/local_suricata_decoder.xml -->
<decoder name="custom-eve-json">
  <prematch>^{"</prematch>
  <plugin_decoder>JSON_Decoder</plugin_decoder>
</decoder>
XML
<!-- Path: /var/ossec/etc/rules/local_rules.xml -->
<group name="nids,json_alerts,">
  <rule id="86600" level="3">
    <decoded_as>custom-eve-json</decoded_as>
    <field name="event_type">^alert$</field>
    <description>Suricata Engine Generated Network Detection Event Notification.</description>
  </rule>

  <rule id="86601" level="12">
    <if_sid>86600</if_sid>
    <field name="data.alert.severity">^1$</field>
    <description>Critical Threat Warning: NIDS Signature Match Triggers Level-1 Event Action.</description>
    <mitre><id>T1071</id></mitre>
  </rule>
</group>
Using clear conditional logic in rules ensures the platform filters out low-severity background noise automatically. This filtering directs analyst attention toward events indicating active security risks.
This rule design helps the platform prioritize high-severity events instantly across enterprise clusters. It creates a structured hierarchy that supports efficient automated remediation workflows.
Production Logs and Validation Traces
Validating ingestion pipelines requires verifying that simulated network exploits trigger the correct detection and ruleset paths. Testing with specific network probes should generate immediate, structured output logs.
[Simulated Hypervisor Terminal Output]
root@analyst-workstation:~# nmap -sS -p 445 10.10.20.5
Starting Nmap 7.94 ( https://nmap.org ) at 2026-05-18 20:45:11 GMT
Nmap scan report for prod-sql-cluster-01 (10.10.20.5)
Host is up (0.0012s latency).
PORT    STATE SERVICE
445/tcp open  microsoft-ds
[Simulated Hypervisor Terminal Output]
root@siem-core-01:~# tail -n 1 /var/ossec/logs/alerts/alerts.json | jq '.'
{
  "timestamp": "2026-05-18T20:45:12.119421+0000",
  "rule": {
    "id": "86601",
    "level": 12,
    "description": "Critical Threat Warning: NIDS Signature Match Triggers Level-1 Event Action.",
    "mitre": {
      "id": [
        "T1071"
      ]
    }
  },
  "agent": {
    "id": "004",
    "name": "ids-node-01"
  },
  "data": {
    "src_ip": "192.168.42.115",
    "dest_ip": "10.10.20.5",
    "dest_port": "445",
    "proto": "TCP"
  }
}
The matching log record confirms the detection pipeline processed the event data correctly. It shows the system extracted the necessary telemetry and assigned the appropriate threat level.
This verification loop demonstrates the stability of the collection framework. Security teams can trust that the platform will capture and classify production network threats reliably.
Operational Triage Playbooks and Severity Escalation Automation
Deterministic Filtering for Critical P1 Events
Handling high-priority events requires automated workflows that minimize manual validation steps for analysts. The management platform should evaluate event variables against known operational baselines instantly.

If an event targets core infrastructure assets using high-risk exploits, the platform escalates its priority immediately. This rapid filtering ensures containment actions begin before a threat can spread.
Python
# Path: /usr/local/bin/triage_classifier.py
# Description: Automates incident priority classification based on incoming telemetry fields.

import sys
import json

def assess_incident(event_json):
    try:
        event = json.loads(event_json)
        dest_ip = event.get("data", {}).get("dest_ip", "")
        dest_port = int(event.get("data", {}).get("dest_port", 0))

        # Enforce deterministic check matching defined critical assets
        if dest_ip.startswith("10.10.") and dest_port in [22, 445, 3389]:
            return "P1_CRITICAL"
        return "P2_HIGH"
    except Exception:
        return "P3_ROUTINE"

if __name__ == "__main__":
    sample_input = sys.stdin.read()
    print(f"Classification Result: {assess_incident(sample_input)}")
)
Running this validation logic at the ingestion layer prevents critical indicators from being missed in large datasets. It gives responders the clear insight needed to manage threats effectively.
This automated filtering approach keeps security teams focused on verifying and resolving genuine high-priority issues. It prevents operational delays from slowing down critical containment actions.
Managing Secondary Indicators and Noise Reduction for P2 Events
Lower-priority threats, such as informational scans or common network probes, require automated containment to avoid distracting analysts. The system should group these repetitive alerts into unified event summaries.
[Simulated Hypervisor Terminal Output]
root@siem-core-01:~# wazuh-regex -match "SCAN" /var/ossec/etc/rules/local_rules.xml
Suppression window active: 3600 seconds for matching signature classes.
Using frequency thresholds helps filter out routine automated traffic from the primary investigation views. This reduction keeps dashboards clean while ensuring logs remain available for long-term review.
XML
<!-- Path: /var/ossec/etc/rules/local_rules.xml -->
<rule id="100060" level="5">
  <if_sid>86600</if_sid>
  <field name="data.alert.signature">^ET SCAN</field>
  <frequency>50</frequency>
  <timeframe>60</timeframe>
  <description>Repetitive Network Reconnaissance Activity Suppressed Automatically.</description>
</rule>
Automating noise reduction protects teams from alert fatigue during routine operations. It keeps security views clean and optimized for identifying complex, targeted attacks.
This suppression strategy balances complete data retention with clear operational visibility. It ensures monitoring views focus on events that require manual review.
Closed-Loop Automation via SOAR Playbooks
When the platform confirms a high-priority incident, it can trigger automated orchestration playbooks to isolate the affected host. This programmatic containment cuts response times down to seconds.
Bash
#!/usr/bin/env bash
# ==============================================================================
# Script Name: isolate-host-node.sh
# Description: Programmatically isolates a compromised host using local firewalls.
# Author: Senior Cybersecurity Operations Engineer
# ==============================================================================

set -o errexit
set -o nounset

TARGET_COMPROMISED_IP="$1"
LOG_AUDIT_PATH="/var/log/active-response-actions.log"

audit_log() {
    echo "$(date '+%Y-%m-%d %H:%M:%S') - [ACTIVE-RESPONSE] - $1" >> "${LOG_AUDIT_PATH}"
}

audit_log "Initiating emergency containment protocol for target: ${TARGET_COMPROMISED_IP}"

# Execute local filtering commands to block communication paths
if sudo iptables -A INPUT -s "${TARGET_COMPROMISED_IP}" -j DROP; then
    audit_log "Successfully applied drop rule for target ${TARGET_COMPROMISED_IP}."
else
    audit_log "ERROR: Failed to apply emergency drop configurations."
    exit 1
fi

exit 0
[Simulated Hypervisor Terminal Output]
root@siem-core-01:~# ./isolate-host-node.sh 192.168.42.115
root@siem-core-01:~# cat /var/log/active-response-actions.log
2026-05-18 21:05:14 - [ACTIVE-RESPONSE] - Initiating emergency containment protocol for target: 192.168.42.115
2026-05-18 21:05:15 - [ACTIVE-RESPONSE] - Successfully applied drop rule for target 192.168.42.115.
Automating initial containment actions helps prevent an attacker from moving laterally through the environment. It limits the impact of an exploit while analysts prepare a full remediation plan.
This closed-loop system ensures rapid, predictable responses to verified threats. It helps security operations centers maintain consistent control over distributed infrastructure.
Strategic Governance and the Evolution of Network Security Analytics
Mitigating Compliance and Audit Security Vulnerabilities
Modern compliance standards require organizations to maintain clear visibility over all internal network boundaries. Implementing standardized telemetry collection satisfies strict verification requirements for data protection audits.
| Standard | Control Framework Requirement | Operational Technical Evidence |
| PCI-DSS 4.0 | Req 11.4: Multi-point intrusion detection and traffic monitoring | JSON-structured logs with active interface binding entries |
| ISO/IEC 27001 | Annex A.12.4: Comprehensive event logging and verification | Persistent audit trails using authenticated logging platforms |
| SOC 2 Type II | Trust Services Criteria: Continuous boundary protection | Validation traces linked directly to configuration management repositories |
Maintaining auditable records of all telemetry changes ensures compliance with global regulatory standards. It provides clear proof to external auditors that the organization monitors its boundaries continuously.
[Simulated Hypervisor Terminal Output]
root@siem-core-01:~# openvas-cli --verify-compliance --policy-id "PCI-DSS-4.0"
Compliance check completed: All network monitoring boundaries match requested controls.
Using automated tools to track compliance status protects organizations from configuration drift over time. It confirms that the monitoring infrastructure consistently meets regulatory demands.
This governance approach aligns daily security operations with broader compliance goals. It ensures the business maintains a verifiable, defensive security posture across all environments.
Machine Learning Applications in Dynamic Alert Prioritization
Using machine learning models allows security platforms to prioritize incoming alerts dynamically based on historical behavior. This approach moves beyond static severity definitions to improve classification accuracy.

These predictive models analyze connection patterns and event frequencies to identify high-risk anomalies. This context-aware filtering helps surface subtle threats that traditional static rules might miss.
[Simulated Hypervisor Terminal Output]
root@analytics-engine-01:~# python3 evaluate_alerts_ml.py --model random_forest.pkl
Model Evaluation Summary:
  - Classification Accuracy: 95.4%
  - False Positive Rate: 1.2%
  - Processing Latency: 4.2ms per event flow
Integrating predictive scoring into the ingestion pipeline improves classification precision across large enterprise environments. This proactive analysis ensures response teams focus on verified security priorities.
This data-driven approach keeps detection systems optimized for changing infrastructure environments. It reduces manual overhead while maintaining high visibility for complex threat vectors.
Modern Zero-Trust Microsegmentation Frameworks
As corporate networks evolve, traditional perimeter security structures must expand to incorporate strict, identity-driven access rules. Zero-trust models require continuous verification of all internal communication paths.
- Workload Identity Validation: Every service connection requires explicit, cryptographic authentication, independent of network location.
- Dynamic Access Enforcement: Security policies adapt automatically as virtual hosts scale across different cluster nodes.
- Granular Activity Monitoring: The platform captures connection logs continuously to ensure compliance with microsegmentation baselines.
Enforcing security boundaries at the workload level helps prevent lateral movement if a single instance is compromised. It contains threats immediately, protecting surrounding infrastructure from unauthorized access.
This comprehensive architectural approach ensures consistent security across hybrid cloud and on-premises environments. It allows organizations to deploy and manage workloads safely, maintaining complete control over all data paths.
Advanced FAQ Section
How many concurrent event flows can an optimized NIDS sensor monitor before dropping packets?
Answer: A properly tuned sensor running on modern hardware can monitor up to 40 Gbps of symmetric traffic without frame loss. Achieving this requires enabling kernel bypass mechanisms like AF_PACKET or DPDK to copy data directly to application memory.
[Simulated Hypervisor Terminal Output]
root@ids-node-01:~# suricata --dump-features | grep "capture-backend"
 - capture-backend: AF_PACKET (Kernel Bypass Enabled)
Organizations must adjust interface ring buffers and use dedicated worker threads to match hardware cores. These configurations prevent internal buffer drops, ensuring stable capture rates during high-volume traffic spikes.
Can custom log decoders parse nested fields from modern application protocols?
Answer: Yes, modern ingestion engines include native JSON decoding modules that parse multi-layered telemetry streams efficiently. These tools extract nested values like TLS signatures without requiring complex regular expressions.
XML
<!-- Parsing validation example for nested schemas -->
<decoder name="nested-json-parser">
  <parent>custom-eve-json</parent>
  <field name="data.tls.ja3">(\d+)</field>
  <description>Extracts nested handshake signatures for immediate comparison against indicator lists.</description>
</decoder>
Using structured decoders reduces parsing overhead compared to legacy text-matching tools. It ensures the platform extracts critical metadata quickly, maintaining high throughput across ingestion paths.
What strategies prevent automated blocklists from accidentally isolating core enterprise infrastructure?
Answer: Automated response systems must use explicit exclusion lists that protect critical infrastructure from accidental containment actions. These rules override automated containment logic across the orchestration platform.
XML
<!-- Path: /var/ossec/etc/rules/local_rules.xml -->
<rule id="100070" level="0">
  <if_sid>86601</if_sid>
  <field name="data.src_ip">^10\.10\.10\.</field>
  <description>Safety Override: Prevent Automated Containment Actions Across Core Management Subnets.</description>
</rule>
Security teams should configure automated playbooks to require manual confirmation for high-criticality assets. This hybrid approach ensures rapid containment for edge nodes while protecting core business applications from accidental disruption.
Summary Reference Tool and Technical Parameters
To help security teams quickly optimize their monitoring configurations, use this matrix to guide schema deployments:
| Monitoring Layer | Target Field | Purpose | Sample Implementation Pattern |
| Core Metadata | flow_id | Links disparate packets into trackable communication streams. | "flow_id": 984512630714 |
| Temporal Data | timestamp | Provides microsecond-precision timing for event correlation. | "timestamp": "2026-05-18T20:15:32.419284+0000" |
| Network Indicators | dest_port | Identifies target services to cross-reference with asset catalogs. | "dest_port": 8080 |
| Contextual Data | mitre_tactic | Maps alerts directly to standardized behavioral categories. | "mitre_tactic": "Execution" |
By structuring telemetry schemas according to this engineer-validated matrix, organization teams can optimize their threat detection processes. This methodical approach ensures your NIDS alert fields for P1 and P2 incidents remain accurate and reliable, allowing your security operations center to protect critical business assets and maintain optimal infrastructure uptime.
LEARN MORE ABOUT SURICATA NIDS
Discover more from Solide Info | The Engineer’s Authority on Cyber Defense
Subscribe to get the latest posts sent to your email.