Establishing an efficient log retention architecture is a critical engineering challenge when balancing threat detection, compliance obligations, and soaring cloud data storage costs.
As enterprises scale, the sheer volume of telemetry data produced by microservices, cloud resources, and security appliances can quickly overwhelm systems.
Without a structured, automated framework, organisations risk exposing themselves to regulatory non-compliance, blind spots during forensic investigations, and runaway infrastructure budgets.
This technical guide provides an exhaustive blueprint for designing, implementing, and optimizing enterprise-grade log storage architectures.
Key Takeaways
- Tiered Storage Architecture: Optimize balance between cost and performance by categorizing logs into hot, warm, and cold tiers based on access frequency.
- Unified Policy Alignment: Align retention timelines directly with compliance standards such as PCI-DSS, SOC 2, HIPAA, and GDPR.
- Cost-Efficient Tooling: Master lifecycle configurations in modern observability tools, specifically focusing on cloud-native patterns.
- Forensic Preparedness: Ensure fast, deterministic log rehydration processes to facilitate rapid security incident investigations and threat hunting.
Architectural Foundations of Enterprise Log Storage
Modern IT systems generate massive volumes of unstructured and semi-structured telemetry data.
Managing this data requires a deep understanding of data lifecycle tiers, regulatory compliance mandates, and log processing pipelines.

Storage Tiering and Data Lifecycle Management
Enterprise storage strategies cannot rely on a single, uniform database tier.
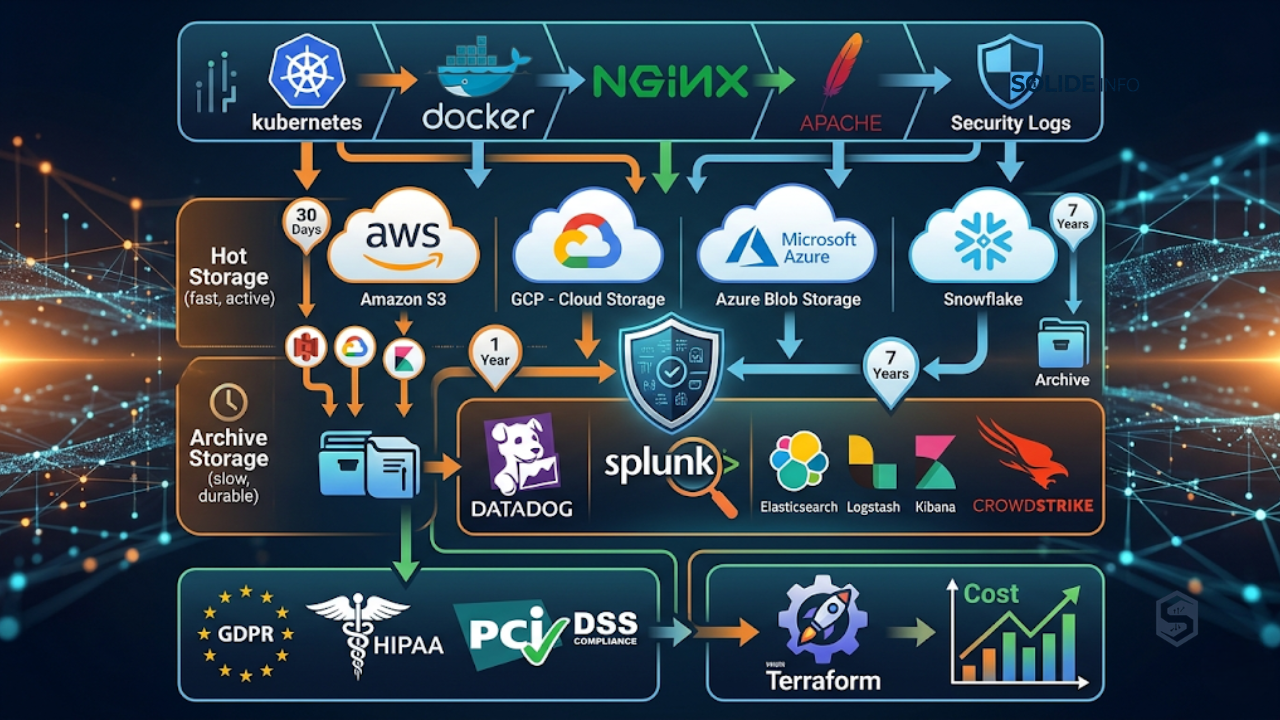
To maintain financial viability, organisations must implement a multi-tiered storage model.
The “Hot” tier utilizes high-performance, solid-state storage (NVMe SSDs) and is dedicated to real-time querying and alerting.
Data in this tier typically remains index-heavy and covers a time window of 7 to 14 days.
This is where your primary Security Information and Event Management (SIEM) analytics and active system troubleshooting occur.
The “Warm” tier transitions data to cheaper block storage or specialized columnar databases.
In this phase, indexing is often reduced, and search performance degrades slightly.
Warm storage typically accommodates data between 15 and 90 days old, allowing teams to perform retrospective analyses on recent anomalies.
Finally, the “Cold” or “Archival” tier utilizes highly cost-effective object storage, such as Amazon S3, Google Cloud Storage, or Azure Blob Storage.
Logs in this tier are compressed into massive flat files (such as GZIP, ZSTD, or Parquet formats) and stripped of active indexes.
Cold storage holds data for months or years to satisfy audit demands, with data retrieved only via programmatic rehydration.
Compliance Frameworks and Legal Requirements
Designing a log retention policy requires precise alignment with international regulatory frameworks.
Failure to retain security logs for mandatory durations can lead to catastrophic legal penalties and loss of operating licenses.
| Compliance Standard | Mandatory Retention Period | Key Telemetry Requirements |
|---|---|---|
| PCI-DSS v4.0 | 1 Year Minimum (3 Months Hot) | Audit trails, system access logs, administrative actions, and firewall events. |
| SOC 2 Type II | Typically 1 Year | User access reviews, system changes, security exceptions, and API transactions. |
| HIPAA (US) | 6 Years | Electronic Protected Health Information (ePHI) access logs, system modifications. |
| GDPR (EU) | Varies (Must justify storage) | Minimization of Personal Data; clear access tracking; prompt deletion post-purpose. |
| FISMA / NIST SP 800-92 | 1 to 3 Years | System events, security controls, authentication attempts, network flows. |
Each framework demands not just storage, but proof of data integrity.
Security audits often require cryptographically signed log files to verify that records have not been altered or deleted during their retention lifecycle.
Log Ingestion Pipelines and Normalization
Before a log reaches any storage tier, it must flow through an ingestion pipeline designed to clean, enrich, and normalize incoming payloads.
Unstructured logs from legacy systems introduce significant storage overhead.
Raw text logs containing stack traces and redundant system metrics consume up to five times more storage space than structured JSON representations.
An enterprise pipeline uses collectors like Fluent Bit, Vector, or OpenTelemetry Collectors to normalize logs at the edge.
By parsing raw text into key-value pairs, pipelines strip out useless verbose text, drop debugging messages under normal operating conditions, and compress payloads.
This normalization ensures uniform querying syntax across different telemetry backends.
Furthermore, ingestion systems must enforce schemas to ensure consistent metadata naming conventions.
For instance, fields representing client IP addresses should consistently use client.ip rather than varying between ip, source_ip, or clientAddress.
This structural consistency drastically improves query performance and reduces the indexing overhead on hot storage nodes.
Implementing Log Retention in Modern Tooling
Different observability and SIEM platforms approach retention through highly distinct mechanical operations.
In this section, we explore how to configure and optimize retention patterns within three dominant industry solutions: Datadog, Grafana Loki,and custom enterprise frameworks.
Managing Datadog Log Retention and Rehydration
Datadog decoupled ingestion from indexing, allowing organisations to capture massive volumes of logs without incurring astronomical index costs.
In the Datadog ecosystem, all logs are ingested and run through the processing pipeline.
From there, users define “Indexes” with specific retention filters and duration limits.

To control datadog log retention budgets, teams deploy exclusion filters.
For instance, a service might generate verbose database connection logs that are useless during standard operations but critical during an incident.
An exclusion filter can drop 99% of these logs at the ingestion phase while archiving 100% of them directly to a cost-effective cloud object storage bucket.
The following Terraform block configures a Datadog log archive alongside an index with restricted retention to show how infrastructure-as-code manages these definitions:
# Configure a Datadog Log Archive targeting an AWS S3 Bucket
resource "datadog_logs_archive" "enterprise_s3_archive" {
  name  = "s3-cold-storage-archive"
  query = "env:production"
  s3_archive {
    bucket     = "corp-datadog-logs-cold-storage"
    path       = "/production-logs/"
    role_name  = "arn:aws:iam::123456789012:role/DatadogLogArchiveRole"
  }
}

# Configure a High-Value Datadog Index with constrained retention
resource "datadog_logs_index" "production_critical_index" {
  name  = "production-critical"
  query = "env:production AND (status:error OR status:critical)"

  # Retention duration in days (Options: 3, 7, 15, 30, 45, 60, 90, 180, 365)
  retention_days = 30

  daily_limit_codec = "quarantined"
  daily_limit       = 5000000000 # 5 Billion log limit per day
}
This configuration ensures that only high-severity production logs are indexed for 30 days of instant access.
All logs, regardless of severity, flow securely to the corporate S3 bucket, where they can be rehydrated back into Datadog on demand if an incident occurs.
Configuring Loki Log Retention and Chunk Storage
Grafana Loki uses an alternative indexing model.
Instead of indexing the entire log message payload, Loki only indexes specific metadata labels.
This architectural design allows for a lightweight index and makes loki log retention highly cost-effective and simple to manage.
Loki stores log data in files called “chunks”, which are pushed to object storage backends.
The retention of these chunks is controlled via a component called the Compactor.
The Compactor manages the deletion of expired chunks based on retention rules defined in Loki’s configuration file.
Here is a production-grade configuration snippet for a Loki Compactor and limits policy (loki-config.yaml):
auth_enabled: false

server:
  http_listen_port: 3100
  grpc_listen_port: 9095

common:
  path_prefix: /var/loki
  storage:
    filesystem:
      chunks_directory: /var/loki/chunks
      rules_directory: /var/loki/rules
  replication_factor: 1

schema_config:
  configs:
    - from: 2023-01-01
      store: tsdb
      object_store: s3
      schema: v13
      index:
        prefix: index_
        period: 24h

limits_config:
  # Enable global retention overrides
  retention_period: 744h # 31 days default retention
  reject_old_samples: true
  reject_old_samples_max_age: 168h # Reject logs older than 7 days at ingest

compactor:
  working_directory: /var/loki/compactor
  shared_store: s3
  compaction_interval: 10m
  retention_enabled: true
  retention_delete_delay: 2h
  retention_delete_worker_count: 150
By activating retention_enabled: true within the compactor block, Loki will continuously scan the S3 object store.
It automatically purges any log chunks that fall outside the retention_period boundary set in the limits_config block.
This model minimizes computational overhead, allowing small engineering teams to run high-volume logging platforms without expensive licenses.
Designing an Enterprise Log Retention Policy
A robust logging framework requires a clear, codified log retention policy document that bridges technical requirements with legal obligations.
This policy acts as the definitive playbook for security, engineering, and compliance teams.
To be effective, your policy should explicitly define several core criteria:
1. Source Classification: Not all logs are created equal. Group your systems into security tiers (Tier 1: Identity and Access Management, Core Firewalls; Tier 2: Production Applications, Database Logs; Tier 3: Internal Development Environments).
2. Deterministic Retention Windows: Set strict storage durations for each tier across hot, warm, and archival states. For example, Tier 1 logs might require 90 days hot access and 7 years of archival, while Tier 3 logs might be deleted entirely after 7 days.
3. Data Protection Controls: Outline encryption requirements for logs both in transit (TLS 1.3) and at rest (AES-256 with customer-managed keys).
4. Strict Access Controls: Implement role-based access control (RBAC). Only security analysts during an active incident response should have privileges to access raw cold-storage log archives.
Technical Architectures and Code-Based Implementations
Operationalizing these retention strategies requires reliable automation.
Manual log deletion is a major risk factor for compliance violations and cloud cost overruns.
In this section, we review automated scripts, cloud-native lifecycle configurations, and the step-by-step logic required to handle log data securely.
Automating Log Archiving and Purging via PowerShell and Python
For on-premise infrastructure, hybrid deployments, or custom cloud VMs, administrators must manage local log directories to prevent disk space exhaustion.
The following PowerShell script runs as a scheduled task to identify, compress, archive, and purge local Windows Event or application logs:
# Windows Log Archival and Purge Automation Script
# Operational Objective: Compress logs older than 14 days, upload to secure UNC path, purge from local disk.

$LocalLogPath  = "C:\AppServer\Logs"
$ArchiveStore  = "\\secure-nas.corp.internal\LogArchive\AppServer01"
$RetentionDays = 14
$PurgeDays     = 90
$CurrentDate   = Get-Date

# Ensure archive target path exists
if (!(Test-Path -Path $ArchiveStore)) {
    New-Item -ItemType Directory -Force -Path $ArchiveStore | Out-Null
}

# Step 1: Compress and Archive Logs Older Than Retention Threshold
$TargetLogsForArchive = Get-ChildItem -Path $LocalLogPath -Filter "*.log" | Where-Object {
    ($CurrentDate - $_.LastWriteTime).Days -gt $RetentionDays -and ($CurrentDate - $_.LastWriteTime).Days -le $PurgeDays
}

foreach ($LogFile in $TargetLogsForArchive) {
    $ZipPath = Join-Path $ArchiveStore "$($LogFile.BaseName)_$($CurrentDate.ToString('yyyyMMdd')).zip"
    if (!(Test-Path -Path $ZipPath)) {
        Write-Output "Compressing and archiving: $($LogFile.FullName)"
        Compress-Archive -Path $LogFile.FullName -DestinationPath $ZipPath -Update
        # Remove original local file once archived safely
        Remove-Item -Path $LogFile.FullName -Force
    }
}

# Step 2: Purge Archived Logs Older Than Absolute Purge Boundary
$TargetLogsForPurge = Get-ChildItem -Path $ArchiveStore -Filter "*.zip" | Where-Object {
    ($CurrentDate - $_.LastWriteTime).Days -gt $PurgeDays
}

foreach ($ArchivedFile in $TargetLogsForPurge) {
    Write-Output "Purging expired log archive: $($ArchivedFile.FullName)"
    Remove-Item -Path $ArchivedFile.FullName -Force
}
For cross-platform or cloud API orchestrations, Python provides a powerful vehicle for scanning and cleaning up logging systems.
This Python script queries an Elasticsearch cluster, extracts logs based on a target index pattern, and deletes indexes older than a specific retention threshold:
#!/usr/bin/env python3
"""
Elasticsearch Index Retention Cleanup Script
Cleans up indices matching a pattern that exceed the defined retention period.
"""

import sys
from datetime import datetime, timedelta
from elasticsearch import Elasticsearch, exceptions

# Configuration Constants
ES_HOSTS = ["https://elasticsearch.internal.corp:9200"]
API_KEY = "Mjg0Nzc4Nzk4OTIxOnNhZmVrZXk=" # Ensure this is injected securely in production
INDEX_PREFIX = "app-logs-"
RETENTION_DAYS = 30

def get_es_client():
    try:
        es = Elasticsearch(
            ES_HOSTS,
            api_key=API_KEY,
            verify_certs=True
        )
        return es
    except Exception as e:
        print(f"Error connecting to Elasticsearch: {e}")
        sys.exit(1)

def purge_expired_indices():
    es = get_es_client()
    cutoff_date = datetime.utcnow() - timedelta(days=RETENTION_DAYS)
    print(f"Purging indices older than: {cutoff_date.strftime('%Y-%m-%d')}")

    try:
        # Retrieve all indices matching prefix
        indices = es.cat.indices(index=f"{INDEX_PREFIX}*", format="json")
        for idx in indices:
            index_name = idx["index"]
            # Extract date string from index pattern (e.g., 'app-logs-2023.11.05')
            date_str = index_name.replace(INDEX_PREFIX, "")
            try:
                index_date = datetime.strptime(date_str, "%Y.%m.%d")
                if index_date < cutoff_date:
                    print(f"Deleting expired index: {index_name}")
                    es.indices.delete(index=index_name)
            except ValueError:
                print(f"Skipping index with non-standard date format: {index_name}")
    except exceptions.ConnectionError as ce:
        print(f"Network connection failed: {ce}")
    except Exception as e:
        print(f"An unexpected error occurred: {e}")

if __name__ == "__main__":
    purge_expired_indices()
Cloud-Native Lifecycle Implementations (AWS S3 and Azure Blob)
To keep costs down, engineering teams often offload long-term log retention directly to cloud object storage.
Both Amazon Web Services (AWS) and Microsoft Azure provide built-in lifecycle management engines that automatically transition log files between storage classes based on the file age.
For instance, an AWS S3 bucket can be configured to transition incoming log files from Standard S3 storage to S3 Glacier Flexible Retrieval after 90 days.
After 365 days, a second rule can run to permanently delete the files.
The following AWS CloudFormation resource template illustrates this automated lifecycle configuration:
AWSTemplateFormatVersion: '2010-09-09'
Description: 'S3 Bucket with Advanced Lifecycle Rules for Enterprise Log Retention'

Resources:
  EnterpriseLogStorageBucket:
    Type: AWS::S3::Bucket
    Properties:
      BucketName: !Sub 'corp-telemetry-retention-${AWS::AccountId}'
      PublicAccessBlockConfiguration:
        BlockPublicAcls: true
        BlockPublicPolicy: true
        IgnorePublicAcls: true
        RestrictPublicBuckets: true
      BucketEncryption:
        ServerSideEncryptionConfiguration:
          - ServerSideEncryptionByDefault:
              SSEAlgorithm: 'aws:kms'
              KMSMasterKeyId: 'alias/aws/s3'
      LifecycleConfiguration:
        Rules:
          - Id: TransitionAndPurgeLogs
            Status: Enabled
            Transitions:
              - TransitionInDays: 90
                StorageClass: GLACIER
            ExpirationInDays: 365
            NoncurrentVersionTransitions:
              - TransitionInDays: 30
                StorageClass: GLACIER
            NoncurrentVersionExpirationInDays: 90
By enforcing encryption and public access blocks inside this infrastructure-as-code template, you prevent accidental data exposure.
At the same time, Glacier transitions automatically keep your long-term storage costs low.
Threat Hunting and Forensic Retrieval Protocols
When a security incident is declared, security analysts must piece together events from multiple sources, some of which may span months.
If the relevant historical logs have transitioned to cold archival storage, the team must run a formal forensic retrieval protocol to reconstruct the timeline.

This rehydration pipeline should be tested regularly.
An untested archival recovery process often breaks during a crisis due to changed IAM permissions, lost encryption keys, or massive API timeouts during retrieval.
Organisations should run simulated incident drills quarterly to verify that log files can be recovered and parsed within their target incident resolution timelines.
Economic Optimizations and Cost Mitigation Strategies
In modern IT departments, logging infrastructure often ranks among the top cloud expenses.
To prevent costs from spiraling out of control, enterprise architects must treat log storage as an asset to be continually optimized.
Controlling SIEM and Observability Platform Spend
The baseline licensing pricing model of most SaaS platforms is billed per gigabyte ingested.
Because of this, sending raw debug logs directly to your SIEM is an expensive anti-pattern.
To keep costs predictable, organizations should separate the ingestion path from the indexing path.
Incoming Logs ---> [ Edge Filters ] ---> Ingestion Buffer (Kafka)
                                              |
                     +------------------------+------------------------+
                     |                                                 |
                     v                                                 v
        [ Filter & Drop Debug Logs ]                       [ Route to Object Storage ]
                     |                                                 |
                     v                                                 v
         Active Index / SIEM Tier (Hot)                    Compressed Archival Tier (Cold)
              (Expensive, Fast)                             (Highly Cost-Effective)
By ensuring that only high-value security events (such as logins, firewall drops, and privilege escalations) are routed to expensive hot-indexed platforms, organizations can reduce licensing fees by up to 60%.
The remaining raw operational telemetry still gets safely routed directly to low-cost object storage buckets for compliance coverage.
Deduplication and Log Filtering at the Edge
A significant portion of raw log volume consists of repeated, redundant strings.
For instance, a database client that encounters a connection failure might write a 500-byte stack trace to its local file system 100 times per second.
If left unfiltered, this single malfunctioning service can generate gigabytes of repetitive data in minutes.
Deploying edge agents like Vector allows you to deduplicate these log bursts before they are sent over the network.
Using deduplication filters, the edge agent detects repeating patterns.
It drops subsequent duplicates and replaces them with a single log entry indicating: "Last log repeated N times".
Additionally, filtering out heavy payload fields that have no analytical value (such as large response payloads or base64-encoded file blocks) further reduces data sizes across the wire.
Cold Storage Audits and Retrieval Cost Modeling
While cold storage services like AWS S3 Glacier offer incredibly low pricing for data at rest, they charge significant fees for data retrieval operations and API requests.
If an administrator runs a broad query that triggers the retrieval of petabytes of raw cold data, the resulting cloud bill can be surprisingly high.
To prevent these unexpected retrieval costs, organizations must model their data retrieval needs.
Before restoring data from archive tiers, analysts should scope down retrieval windows to specific timestamps, servers, and regions.
Additionally, auditing cold storage use monthly ensures that old archives are being cleaned up on schedule and aren’t being retained beyond their required retention periods.
Emerging Trends in Telemetry and Observability Storage
The logging industry is changing rapidly.
Driven by cloud-native complexity and high-speed data streams, new standards are reshaping how we collect, store, and query system telemetry.
OpenTelemetry and Unified Telemetry Schemas
Historically, organizations were locked into proprietary agent formats.
The widespread adoption of OpenTelemetry (OTel) has changed this landscape.
OTel provides a vendor-neutral standard for collecting, processing, and exporting traces, metrics, and logs.
       [ App Core / Cloud Infrastructure / Kubernetes Pods ]
                                |
                                v
               [ OpenTelemetry Collector (OTel) ]
                                |
         +----------------------+----------------------+
         |                                             |
         v                                             v
[ Security SIEM Backend ]                    [ Warm/Cold Object Store ]
 (Splunk, Sentinel, etc.)                     (ZSTD Compressed Parquet)
By implementing the OpenTelemetry protocol (OTLP), organizations can switch logging backends without rewriting application code or redeploying edge collectors.
This standardized schema simplifies ingestion pipelines, resulting in more consistent data structures and easier long-term management.
AI-Driven Anomalous Log Retention and Reduction
Artificial intelligence and machine learning pipelines are now being applied directly at the ingestion boundary.
Instead of relying on static, manual filtering rules, AI-driven log processors analyze data streams in real time to establish baseline patterns of normal application behavior.
Once these patterns are established, the system automatically compresses or drops highly repetitive normal logs while dedicating high-performance, long-term index space to anomalous log sequences.
This smart filtering ensures that security teams always have deep forensic access to anomalous behavior, without paying to store terabytes of normal system operations.
Decentralized and Immutable Ledger Log Storage
For industries requiring strict compliance, such as defense, banking, and healthcare, absolute log integrity is non-negotiable.
If an attacker gains administrative access, their first step is often to modify or delete the very logs that track their actions.
To counter this risk, emerging enterprise architectures utilize write-once-read-many (WORM) storage, decentralized storage networks, and immutable ledger technologies.
By cryptographically anchoring log hashes to an immutable ledger, security teams can mathematically prove to auditors that their historical logs have not been tampered with or modified.
FAQ Section
How do I design a log retention strategy that complies with GDPR’s ‘Right to be Forgotten’ while retaining logs for security analysis?
This is a common point of friction for modern enterprise legal and security teams.
GDPR mandates that personal data must be erased upon request, yet security standards require comprehensive system tracking.
The solution lies in aggressive data minimization, early anonymization, and field-level encryption.
At the ingestion phase, separate personal identifiers (such as usernames, email addresses, and phone numbers) from system audit logs.
Alternatively, hash these values using a salted cryptographic SHA-256 algorithm before writing them to disk.
The raw mapping table linking the hashes to individual users should be kept in a separate database with strict access control.
[ Ingested Raw Log ] ---> [ Hash Identifier ] ---> [ Write Anonymized Log to S3 ]
                                                         |
[ GDPR Erasure Request ]                                 v
        |                                       Logs remain structurally intact
        v                                       for forensic and security analysis,
[ Delete Key from Mapping DB ] -------------->  but can no longer be linked back to a person.
If a user submits an erasure request, you simply delete their mapping key from that database.
The historical logs themselves remain intact for security analysis, but because the mapping key is gone, those logs are permanently anonymized and no longer constitute personal data under GDPR.
What are the real cost differences between storing compressed JSON logs versus columnar formats like Parquet?
Storing logs as raw, uncompressed text or standard JSON is highly inefficient for cold storage archives.
A standard JSON log line repeats keys (such as "timestamp":, "service_id":, "message":) in every single record, which leads to massive data redundancy.
JSON Format (Row-Based, Repetitive Metadata):
{"timestamp": "1710000001", "level": "error", "message": "Failed db connection"}
{"timestamp": "1710000002", "level": "info",  "message": "Retry successful"}

Parquet Format (Columnar, Highly Compressed Metadata):
[Timestamps] 1710000001, 1710000002
[Levels]     error, info
[Messages]   Failed db connection, Retry successful
Transitioning log archives to columnar formats like Apache Parquet or ORC delivers significant improvements:
- Compression Optimization: Columnar formats group identical data types together. This allows modern compression algorithms like Snappy or ZSTD to achieve compression ratios of up to 10:1, compared to about 3:1 for raw JSON.
- Query Performance: Query engines like AWS Athena or Google BigQuery can skip reading entire columns that aren’t specified in your query. If you run a search searching only for
errorevents, the engine only scans thelevelcolumn, drastically reducing data scan costs.
On average, converting raw JSON logs to compressed Parquet files before long-term archival reduces storage costs by 60% to 80% and accelerates query speeds by up to 10x.
Why does a wild-card log querying approach cause performance bottlenecks, and how can indexes mitigate this?
A wildcard search (e.g., searching for *error* across a massive database) forces the underlying query engine to perform a full table scan.
The database must read every single byte of every log message in the target time window to check for matches, which causes heavy CPU and disk utilization.
Indexes mitigate this by organizing terms into structured lookups:
Unindexed Raw Storage (Full Table Scan Required):
[Log 1] "Connection timed out on host-abc-01"
[Log 2] "User login succeeded"
[Log 3] "Fatal error on host-abc-02"

Inverted Index Structure (Instant Lookup):
"host-abc-01" -> [Log 1]
"host-abc-02" -> [Log 3]
"error"        -> [Log 3]
"login"        -> [Log 2]
To prevent performance bottlenecks, enforce structured indexing strategies:
* Index Key Metadata Fields: Ensure fields like env, service_name, and status are indexed as specific metadata labels.
* Avoid High Cardinality Labels: Do not index fields with unique values (such as transaction IDs or request IDs) as primary index labels in systems like Loki, as this can degrade index performance.
* Encourage Exact Matches: Train security analysts to query specific fields (e.g., status:error) rather than relying on broad, wildcard text searches.
How do I handle clock drift across global servers to ensure correct log ordering?
In distributed environments, even minor clock variations can cause logged events to appear out of order.
This clock drift makes it incredibly difficult to reconstruct the exact sequence of events during a security incident.
To address this challenge:
* Enforce Network Time Protocol (NTP): Ensure all servers, containers, and network devices synchronize their clocks with highly reliable NTP or PTP (Precision Time Protocol) servers.
* Utilize High-Resolution Timestamps: Capture timestamps with microsecond or nanosecond precision, always using the ISO 8601 standard in UTC (e.g., 2024-11-15T14:30:00.123456Z).
* Leverage Ingestion Ordering ID’s: Use distributed brokers like Apache Kafka to assign monotonic sequence numbers to incoming events. This ensures that even if individual server clocks drift slightly, the logs can still be ordered based on the sequence in which they were received by the ingestion cluster.
Building a scalable log retention framework requires balancing performance, cost, and compliance.
By implementing structured storage tiers, using automated cleanups, and leveraging modern formats like Parquet, teams can maintain deep system visibility without running over budget.
As your systems scale, continue to audit storage usage, refine your policies, and test your recovery pipelines regularly.
Establishing a resilient, automated log architecture protects your systems, ensures audit readiness, and keeps your cloud infrastructure efficient for years to come.
Discover more from Solide Info | The Engineer’s Authority on Cyber Defense
Subscribe to get the latest posts sent to your email.