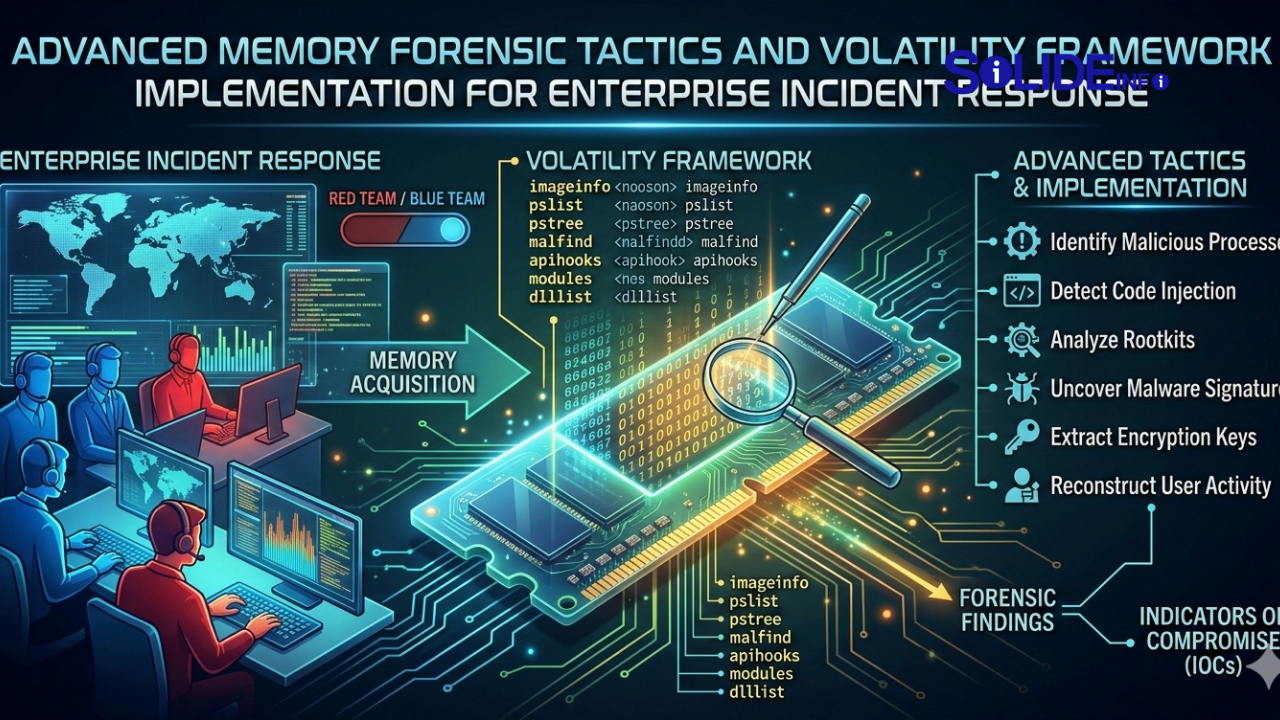
In a post-compromise scenario, the first 60 minutes of log preservation and volatile data capture are critical to determining the true scope of an adversary’s footprint. Traditional disk forensics often fails to capture the subtle nuances of fileless malware, reflective DLL injection, and kernel-level rootkits that exist solely within the system’s RAM. To counter these sophisticated threats, the volatility framework has emerged as the industry standard for memory forensic analysis, providing Blue Teamers with the surgical precision required to reconstruct malicious activity. By pivoting from static disk analysis to a dynamic memory-first approach, incident responders can uncover hidden execution paths and C2 communication channels that remain invisible to standard EDR solutions. Mastering the volatility framework is no longer optional for L3 analysts; it is the definitive barrier between a contained incident and a catastrophic data breach.
This article serves as a comprehensive technical manual for deploying the volatility framework in high-pressure SOC environments. We move beyond basic pslist commands to explore deep-memory artifacts, kernel-level hooks, and the integration of automated analysis pipelines.
Key Takeaways:
- VAD Node Analysis: Why Virtual Address Descriptor (VAD) scanning is superior to standard process listing for detecting stealthy code injections.
- Kernel Object Manipulation: Identifying Direct Kernel Object Manipulation (DKOM) techniques used by rootkits to hide processes from the Windows API.
- Automated Triage: Utilizing Python-based wrappers and LLM-assisted interpretation to reduce the mean-time-to-detection (MTTD) for memory-resident threats.
- Network Artifact Recovery: Extracting dormant socket information and DNS cache remnants that persist only in volatile memory.
The Technical Anatomy of the Volatility Framework
The volatility framework operates by parsing the raw bytes of a memory dump and reconstructing the complex data structures used by the Operating System (OS). Unlike live response tools that rely on API calls—which can be subverted by malware—Volatility performs “offline” analysis, meaning it interprets the memory image without trusting the compromised OS’s own reporting mechanisms.
Architecture and Symbol Tables
With the transition to Volatility 3, the framework moved away from rigid “profiles” toward a more flexible symbol-based architecture. Symbol tables (JSON format) allow the engine to map specific offsets in memory to OS structures like _EPROCESS or _ETHREAD.
Memory Analysis Architecture
| Component | Function |
| Translation Layers | Handles the mapping between physical RAM addresses and virtual addresses used by processes. |
| Symbol Tables | Provide the ‘map’ for the OS version, defining where specific kernel structures begin and end. |
| Automagic | A Volatility 3 feature that automatically detects the OS and architecture of a memory dump. |
| Plugins | Discrete Python scripts that perform specific tasks, such as scanning for network connections or dumping files. |

Forensic Artifact Analysis: Which Data Matters and Why?
Effective memory forensic investigation requires knowing which structures are most likely to be tampered with. In modern Windows environments, the focus has shifted from simple process names to memory protection constants and handle tables.
1. Process Hollowing and Injected Code
Malware often uses NtUnmapViewOfSection to hollow out a legitimate process (like svchost.exe) and replace its code with a malicious payload. Standard process lists will show a legitimate binary, but the volatility framework‘s windows.malfind plugin detects memory segments marked as PAGE_EXECUTE_READWRITE (RWX), which is a high-fidelity indicator of injection.
2. The Power of VAD (Virtual Address Descriptor)
The VAD tree is the kernel’s way of tracking which ranges of virtual memory are allocated to a process. By analyzing the windows.vadinfo output, analysts can find “private” memory allocations that are executable but do not correspond to any file on disk—a classic sign of fileless malware.
3. Registry and Persistence in RAM
While the registry is a disk-based artifact, the “hives” are loaded into memory for active use. Plugins like windows.registry.hivelist and windows.registry.printkey allow you to extract persistence mechanisms (Run keys, Service configurations) even if the attacker attempted to wipe the on-disk logs before the system was shut down.
Step-by-Step Incident Response Workflow: Detection to Eradication
As a Blue Team lead, your workflow must be repeatable and defensible. The following sequence is optimized for high-stakes DFIR environments.
Phase 1: Rapid Triage
Initial assessment involves identifying the “state of the union.” Use windows.info to confirm the kernel version and windows.pslist to view the high-level process tree.
Phase 2: Deep Hunting for Stealth
If a process looks suspicious, or if you are hunting for an unknown threat, pivot to psscan. This plugin finds _EPROCESS structures by scanning for headers, revealing processes that have been unlinked from the active list by rootkits.
Phase 3: Extraction and Reverse Engineering
Once a suspicious memory range is identified, use windows.memmap to dump the specific pages for static analysis in a sandbox or disassembler.
import subprocess
import json

def run_volatility_plugin(dump_path, plugin_name):
    """
    Executes a Volatility 3 plugin and returns the output as JSON.
    """
    cmd = [
        "python3", "vol.py",
        "-f", dump_path,
        f"windows.{plugin_name}",
        "--renderer", "json"
    ]

    try:
        result = subprocess.run(cmd, capture_output=True, text=True, check=True)
        return json.loads(result.stdout)
    except Exception as e:
        print(f"Error executing {plugin_name}: {e}")
        return None

# Example Usage for SOC Triage
# targets = run_volatility_plugin("mem.raw", "pslist")
# for proc in targets:
#     if proc['ImageFileName'] == "cmd.exe":
#         print(f"Alert: CMD execution found at PID {proc['PID']}")
Automating Memory Forensics with AI and LLMs
The volume of data in a 64GB RAM dump can overwhelm even the most experienced L3 analyst. The next frontier in memory forensic science is the application of Large Language Models (LLMs) to interpret complex output.
1. Contextual Sense-Making
By feeding the output of windows.pstree and windows.netscan into a fine-tuned security LLM, analysts can receive a natural language summary of the activity. For example: “The process explorer.exe (PID 1484) spawned an unusual child reader_sl.exe (PID 1640), which is currently communicating with a known Metasploit C2 IP on port 4444.”
2. Automated Sigma Rule Generation
Advanced SOCs are now using AI to translate memory-found anomalies into permanent detection rules. If a specific memory-only DLL unlinking pattern is found using the volatility framework, the AI can generate a Sigma rule to detect similar behavior in the future via EDR telemetry.

Tooling Landscape: Enterprise vs. Open Source
Choosing the right toolset depends on your organization’s maturity and budget. While the volatility framework is the gold standard for depth, enterprise tools offer speed and scale.
| Feature | Volatility Framework (Open Source) | Enterprise (e.g., Magnet AXIOM / EnCase) |
| Depth | Unmatched; allows for custom plugin development. | High, but often limited to “canned” reports. |
| Scale | Requires manual scripting or SOAR integration. | Built-in remote acquisition and mass scanning. |
| Cost | Free (GPL License). | High Licensing Fees (). |
| Updates | Rapid community-driven updates for new OS versions. | Slower, vendor-validated release cycles. |
Technical Log Integration and MISP/CTI
No memory forensic investigation should exist in a vacuum. Indicators of Compromise (IoCs) found in RAM—such as mutex names, temporary file paths, and C2 domains—must be ingested into your Threat Intel Platform (TIP).
Relevant Logs for Correlation:
- Sysmon Event ID 7: Image Loaded (Correlate with
dlllist). - Sysmon Event ID 10: Process Access (Correlate with
handlesto see if malware is reading other processes’ memory). - Windows Event ID 4688: New Process Creation (Compare with
pstreeto find “ghost” processes that were never logged by the OS).
Sigma Rule for Memory-Resident Suspicion
title: Potential Process Hollowing via Volatility Artifacts
status: experimental
description: Detects processes that typically do not have RWX memory segments.
logsource:
    product: windows
    service: sysmon
detection:
    selection:
        EventID: 10
        TargetImage: 'C:\Windows\System32\svchost.exe'
        GrantedAccess: '0x1F1FFF' # Full Access
    condition: selection
falsepositives:
    - Highly specialized debuggers or security software.
level: high
Technical Deep-Dive
Q: Why does pslist miss hidden processes that psscan finds?
A: pslist traverses the doubly-linked list of _EPROCESS structures used by the Windows scheduler. Advanced rootkits “unlink” themselves from this list. psscan ignores the list and scans the entire memory space for the physical signature of an _EPROCESS header.
Q: Can the Volatility Framework analyze encrypted memory?
A: Generally, no. Memory must be captured in its decrypted state (usually from the live system). However, if you have the BitLocker keys, you can decrypt the hibernation file (hiberfil.sys) and analyze it as a memory image.
Q: How do I handle “Pagefile” analysis?
A: Volatility can incorporate pagefile.sys into its analysis using translation layers. This is vital because modern Windows OSs “page out” inactive memory segments to disk, which might contain the very malware strings you are looking for.
The volatility framework remains the most formidable weapon in the arsenal of a DFIR specialist. By mastering memory forensic techniques, you move from merely reacting to alerts to actively hunting and dissecting the most advanced persistent threats (APTs) in the landscape today. Whether you are automating your SOC with AI or performing manual kernel-level analysis, the insights gained from volatile memory are the ultimate source of truth in cybersecurity.
Discover more from Solide Info | The Engineer’s Authority on Cyber Defense
Subscribe to get the latest posts sent to your email.